No matter what kind of warehouse you run, there are key performance indicators (KPIs) that you should be tracking to measure success.
“Every successful warehouse operation is driven by three main KPI’s. Expert knowledge of the product size, expert knowledge of the SKU’s and their velocities, and optimizing the facility layout.”
Michael Bertram, Major Accounts Manager Hy-Tek Material Handling, LLC.
“Every successful warehouse operation is driven by three main KPI’s. Expert knowledge of the product size, expert knowledge of the SKU’s and their velocities, and optimizing the facility layout.” – Michael Bertram
In this article, we’ll go over 30 different warehouse KPI metrics, grouped into the following eight categories:
- Inventory
- Receiving
- Putaway
- Picking
- Distribution
- Storage
- Safety
- Employees
Why are Warehouse Key Performance Indicators Important?
The supply chain is a complex web of interconnected parts that work together to move goods from producers to consumers. The warehouses that lie at the heart of this process are critical links, and it’s important to track their performance with accurate key performance indicators (KPIs). By doing so, you can set benchmarks and identify problems that need to be fixed in order to improve warehouse performance. This, in turn, can help you reduce warehouse costs and increase customer satisfaction.
MHI’s WERC (Warehouse Education and Research Council) recent edition of DC Measures listed industry leaders’ top metrics for distribution centers. Below are the top 6 metrics:
- Average Warehouse Capacity Used
- Order-Picking Accuracy
- On-Time Shipments
- On-Time Ready to Ship
- Peak Warehouse Capacity Used
- Dock-to-Stock Cycle Times
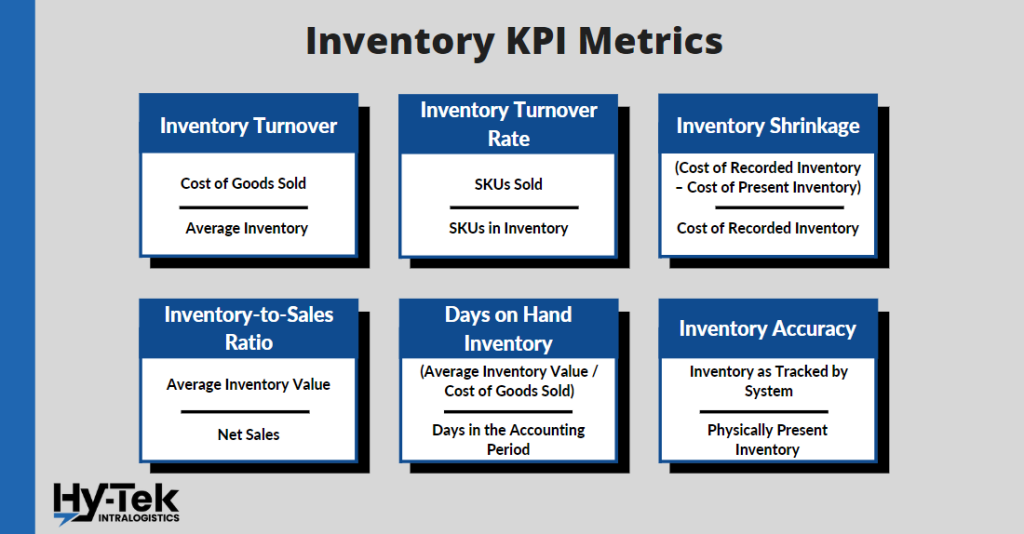
Inventory KPI Metrics
Inventory KPIs help you measure the efficiency and effectiveness of your warehouse stock and the management of that stock. By tracking inventory levels, you can make sure that you have enough stock on hand to meet customer demand, while also avoiding overstocking or running out of stock.
1. Inventory Turnover
What it is: Inventory turnover is a key warehouse management KPI that reflects how quickly stock can be sold or shipped. A high inventory turnover means less money is invested in storage, leading to higher profits.
How to Calculate it: (Cost of Goods Sold) / (Average Inventory)
Tips for Improving Inventory Turnover:
- Master your inventory forecasting skills.
- Identify slow-moving stock and put inventory reduction strategies in place.
2. Inventory Turnover Rate
What it is: Inventory turnover rate is a way of measuring how often a company’s stock of a particular SKU is replenished. For example, if you had 100 shoe boxes available during Q2 and sold 200 in a quarter, the turnover rate would be two. This metric can be useful in estimating inventory velocity or selling prices.
How to Calculate it: (SKUs Sold) / (SKUs in Inventory)
Tips for Improving Inventory Turnover Rate:
- Improve your forecasting techniques and accuracy.
- Improve order management by focusing on advance orders to eliminate excess inventory.
- Remove safety stock.
3. Inventory shrinkage
What it is: Inventory shrinkage is a measure of lost or missing inventory and can be caused by theft, damage, or simple mistakes. This can have a significant impact on a company’s profitability, so this KPI is essential for finding the value of the inventory that is missing from your warehouse.
How to Calculate it: (Cost of Recorded Inventory – Cost of Physically Present Inventory) / Cost of Recorded Inventory
Tips for Improving Inventory Shrinkage:
- Optimize the security of your warehouse.
- Barcodes and SKU numbers should be created for every item.
- Consistently monitor your inventory levels.
- Conduct regular inventory audits.
- Optimize facility layout to minimize risk of product damage
4. Inventory-to-Sales Ratio
What it is: The inventory-to-sales ratio measures how much inventory a company has in comparison to how many sales it has fulfilled. This can help a company avoid situations where inventory is accumulating on the shelves and not selling. A high inventory-to-sales ratio may indicate that a company is having trouble moving its product and may need to adjust its pricing or marketing strategy.
How to Calculate it: (Average Inventory Value) / (Net Sales)
Tips for Improving Inventory-to-Sales Ratio:
- Improve your forecasting so that your supply is meeting demand.
- Run promotional activities or other sales incentives to increase sales.
- Eliminate products that are considered to be dead stock.
5. Days on Hand Inventory
What it is: Inventory days on hand is a metric that shows how quickly a firm’s average stock of goods is sold. This number is important for financial analysts and investors to understand how efficiently a business uses inventory dollars. Inventory is typically a merchant’s biggest investment, so it’s important to know how long capital is being tied up in inventory and what optimizations can be made to the procurement and sales process to shorten that time. In a nutshell, the faster a business sells through its existing inventory, the sooner it will see a return on its investment.
How to Calculate it: (Average Inventory) / (Cost of Goods Sold) / (Days in the Accounting Period)
Tips for Improving Days on Hand Inventory:
- Lower your reorder points to avoid overstocking.
- Only stock extra inventory when you are anticipating extra demand (holidays and peak seasons).
6. Inventory Accuracy
What it is: Inventory accuracy is a measure of how well the amount of inventory tracked matches the amount of inventory present in the warehouse (typically tracked by a warehouse management system). This number can be affected by factors such as theft, damage, miscalculations, and shortages on the supplier’s side. The inventory accuracy KPI will show if there is a difference between the two values. This number is important because it can help to improve the efficiency of the warehouse and avoid potential losses.
How to Calculate it: (Inventory as Tracked by System) / (Physically Present Inventory)
Tips for Improving Inventory Accuracy:
- Benchmark your current inventory accuracy and select an inventory quality program (ISO, lean manufacturing, six sigma, kaizen) to follow.
- Develop a continuous cycle-counting program.
- Select an RFID technology to track inventory.
- Optimize facility layout to minimize honeycombing/wasted space.
- Add a WMS to your system.
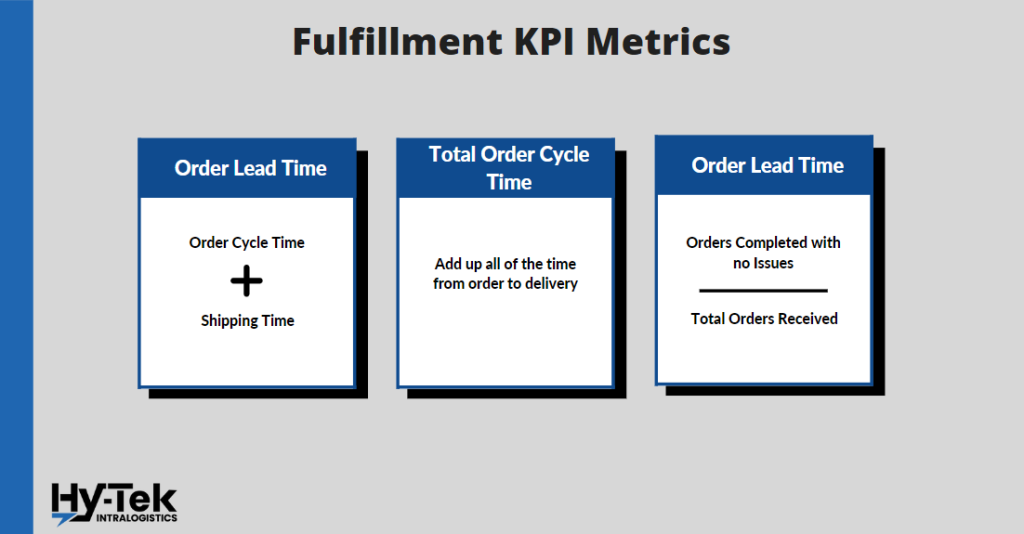
Fulfillment KPI Metrics
7. Order Lead Time
What it is: Order lead time is a warehouse management KPI that measures how quickly consumers receive their orders. The faster the order runs, the better the customer experience will be. Because of this, the best lead times are determined by a total KPI such as order cycle time. Order lead time can have a direct impact on reducing the time between customers ordering, in turn improving retention.
How to Calculate it: (Order Cycle Time) + (Shipping Time)
Tips for Improving Order Lead Times:
- Select vendors closer to your facility.
- Automate the actions involved in processing your orders.
- Maintaining real-time inventory data.
- Use workflow technology to improve internal communication by routing order-related papers immediately to the correct department and notifying involved personnel.
8. Total Order Cycle Time
What it is: The total order time is the average delivery time for a particular order, starting when a buyer places an order. This includes all the buyer and seller processes, such as accepting orders, choosing products, packing, and shipping. The shorter this time period is, the more likely customers are to remain loyal.
How to Calculate it: (Time From Placement of Order) – (Shipping Time)
Tips for Improving Order Lead Times:
- Review your picking, packing and shipping processes to uncover areas you can save time.
- Look for inefficiencies in available inventory.
- Optimize inventory replenishment.
9. Fulfillment Accuracy Rate
What it is: The fulfillment accuracy rate measures how many successful orders are completed based on the total number of orders received. The order must contain the right product on time for it to count as a successful order. A lower accuracy rate means that there are issues with the order processing process that need to be reviewed and addressed.
How to Calculate it: (Orders completed with no issues) / (Total orders received)
Tips for Improving Fulfillment Accuracy Rate:
- Set order accuracy goal rates.
- Improve inventory management by improving inventory organization and stock control.
- Optimize or automate your picking and packing process.
- Implement an order verification system.
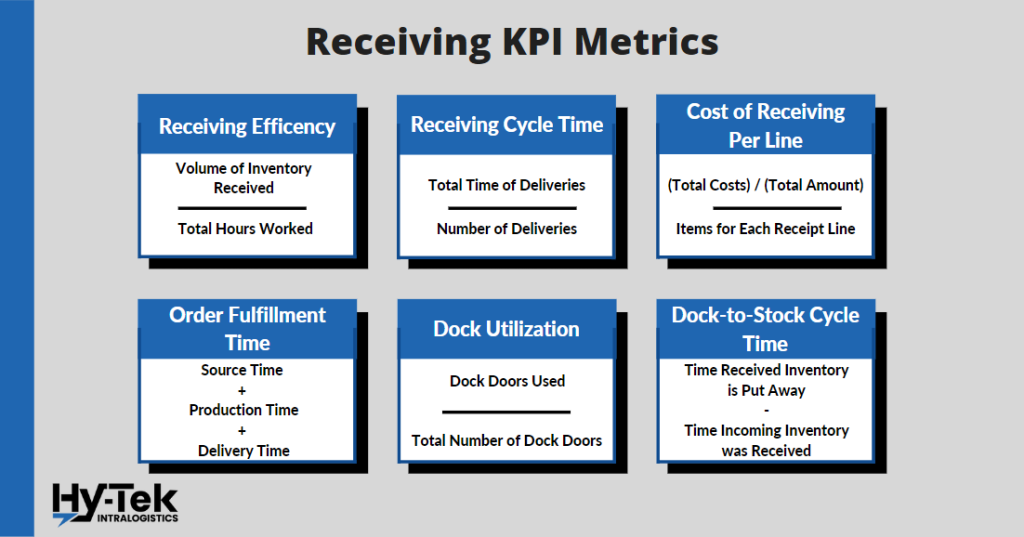
Receiving KPI Metrics
10. Receiving Efficiency
What it is: When products have been received from the warehouse and booked, the process begins. It is feasible to keep track of time spent counting, booking, and preparing for the disposal of received stocks. You should note the specific time for all delivered stock and record another timestamp once this stock is ready to be discarded. You can calculate a month’s average and compare it with past performances.
How to Calculate it: (Volume of Inventory Received) / (Total Number of Hours Worked)
Tips for Improving Receiving Efficiency:
- Focus on pre-receiving processes: label position, label information, items per carton, and the number of packages per pallet.
- Match and correctly schedule your labor hours with the incoming shipment workload.
11. Receiving Cycle Time
What it is: The total time it takes for a given transaction, from start to finish, is called the receiving cycle time. This includes the time it takes for the product to be shipped, received, and processed.
A solid measurement to start with is the units per hour (UPGH) processed as a collective team and by each individual. These can be single items, totes, or pallets. The important part is that you are measuring these figures and the impact that new systems or processes have towards increasing picking, shipping, and receiving speeds.
How to Calculate it: (Total Time of Deliveries) / (Number of Deliveries)
Tips for Improving Receiving Efficiency:
- Reduce travel time on warehouse procedures to avoid bottlenecks.
- Place resources where they are most needed within the facility.
- Prioritize replenishments before they occur to avoid stockouts.
12. Cost of Receiving Per Line
What it is: The average cost of receiving per line is based on how often the customer receives the product. It includes the delivery process, handling, and accounting for each product. The cost would go down as time passed, suggesting a productivity improvement.
How to Calculate it: (Total Costs) / (Total Amount) / (Items for each Receipt Line)
Tips for Improving Cost of Receiving Per Line:
- Improve labeling accuracy with RFID scanners or automated pallet management and storage.
- Add or improve your inspection of incoming and outgoing items.
13. Order Fulfillment Time
What it is: The order fulfillment timeline is the time between when a customer orders and when they receive the product. This can vary depending on inventory availability, shipping times, and how quickly orders are shipped. Speed is the key factor in assessing fulfillment.
How to Calculate it: (Source Time) + (Production Time) + (Delivery Time)
Tips for Improving Order Fulfillment Time:
- Audit your internal order system and talk to stock room employees to find areas of improvement.
- Simplify your system for stocking inventory to improve inventory management and theft prevention.
14. Dock Utilization
What it is: The percentage of dock doors that were utilized. This will help you figure out if your docking areas have more or less receiving capacity.
How to Calculate it: (Dock Doors Used) / (Total Number of Dock Doors)
Tips for Improving Dock Utilization:
- Invest in a yard and dock management system to identify issues and potential bottlenecks before they enter the warehouse.
- Receive real-time loading dock updates to help reduce labor hours.
15. Dock-to-Stock Cycle Time
What it is: The dock-to-stock cycle time is the time it takes for inventory to be received and put into stock. It begins when your warehouse receives delivery of goods from the supplier and ends when those goods are put away and recorded into the inventory management system.
How to Calculate it: (Time Received Inventory is Put Away) – (Time Incoming Inventory was Received)
Tips for Improving Dock-to-Stock Cycle Time:
- Reduce movement required by warehouse employees by tracking movement and identifying areas where you have wasted steps.
- Eliminate paperwork by upgrading to RFID scanners and an automated inventory management system.
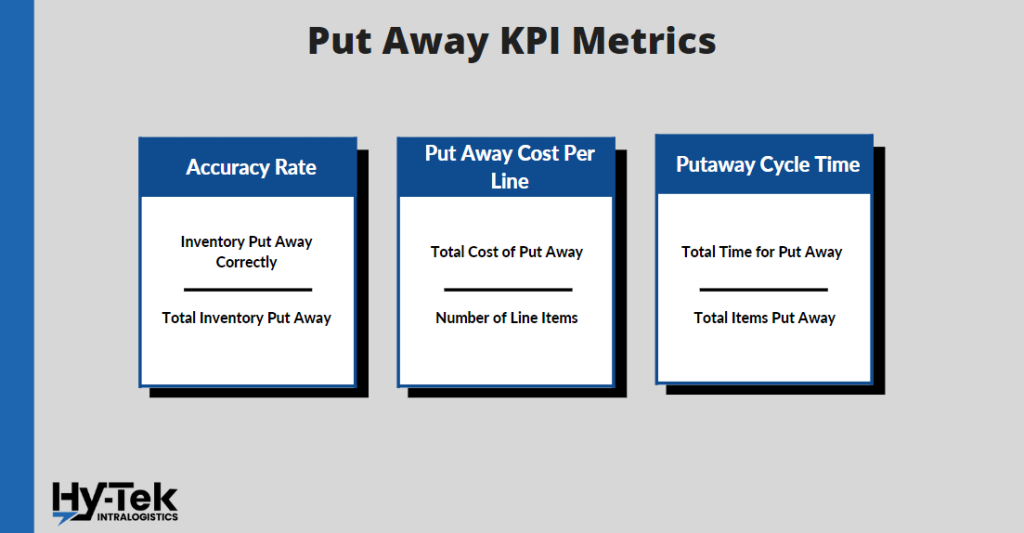
Put Away KPI Metrics
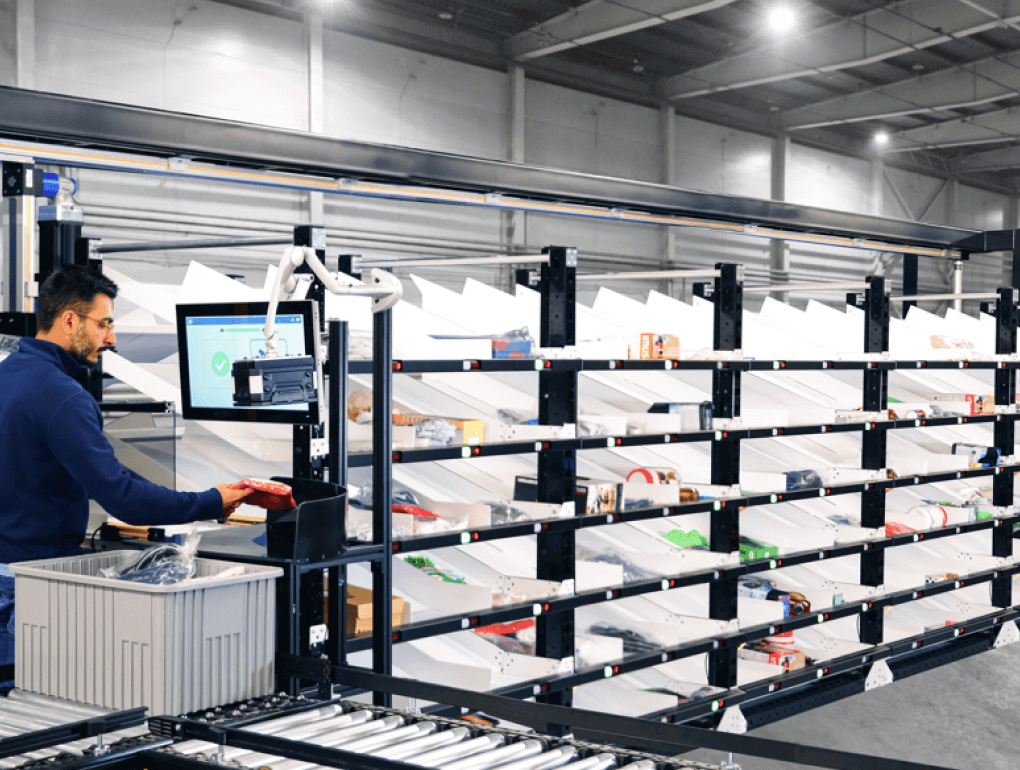
Put away is the technique of storing the delivered item in its designated area in the warehouse. The KPIs for put away is critical to understanding how these procedures function and what they are best at.
16. Accuracy Rate
What is it: A high accuracy rate is essential for a good warehouse management system, as it impacts the loading rate and can cause traffic congestion. A good accuracy rate ensures that the correct inventory is removed and items are not left behind.
How to Calculate it: (Inventory Put Away Correctly) / (Total Inventory Put Away)
Tips for Improving Dock-to-Stock Cycle Time:
- Ensure proper slotting of products and product velocity.
- Maintain accurate inventory data with clear signage, rack labels, and product labels.
- Utilize material handling systems, including, barcode scanners, conveyor belts to shuttle systems, and mobile robots where necessary to improve warehouse processes and accuracy.
17. Put Away Cost Per Line
What is it: This KPI measures the average cost to put a received line of inventory into storage or active pick locations. Tracking the put away cost per line can help you identify areas of inefficiency. Improvements should be focused on areas with a higher calculated cost per line.
How to Calculate it: (Total Cost of Put Away) / (Number of Line Items)
Tips for Improving Put Away Cost Per Line:
- Introduce real-time reporting with a Warehouse Management System (WMS) to find the most optimal storage locations and processes.
- Use direct put away to eliminate staging locations and speed up put away times.
- Reduce your travel time from receiving to storage areas.
- Utilize material handling systems to reduce touchpoints in the put away process.
18. Put Away Cycle Time
What is it: Put away cycle time is the amount of time it takes put away a single item of inventory. Shorter put away intervals are a result storage efficiency. Optimizing your inventory locations will improve put away efficiencies and decrease the put away cycle time.
How to Calculate it: (Total Put Away Time) / (Total Items Put away)
Tips for Improving Putaway Cycle Time:
- Improve warehouse employee productivity with incentives.
- Reduce your travel time from receiving to storage areas.
- Add real-time reporting with a WMS
- Optimize your storage locations through proper slotting.
Picking KPI Metrics
Picking rates in the warehouse have a direct influence on lead times, therefore the greater your accuracy, the shorter your lead times will be and, as a result of this, improved customer satisfaction.
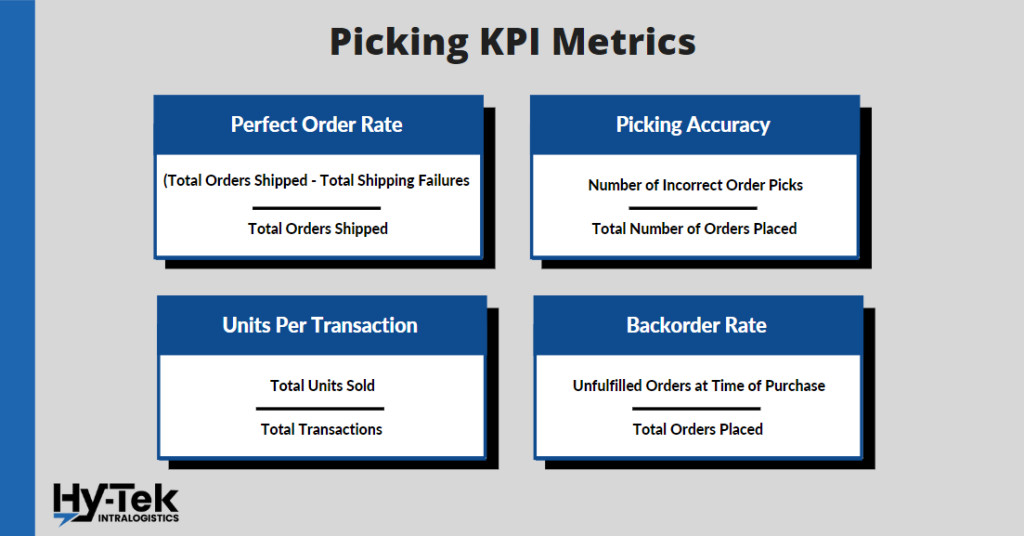
19. Perfect Order Rate
What is it: The perfect order rate is the percentage of orders that are delivered to your warehouse without any incidents. This is achieved by ensuring that the right items arrive promptly and are received in excellent condition by customers who bought them.The Lean Sigma approach is to identify problems before items leave the warehouse.
How to Calculate it: (Total Orders Shipped) – (Total Shipping Failures) / (Total Orders Shipped)
Tips for Improving Perfect Order Rate:
- Establish an order fulfillment process.
- Use of automation to improve ordering, inventory management and customer service.
- Improve customer communication procedures.
20. Picking Accuracy
What it is: To ensure that they are providing the best possible service to their customers while also driving down the costly returns process, warehouses need to track their picking accuracy.
How to Calculate it: (Number of Incorrect Order Picks) / (Total Number of Orders Placed)
Tips for Improving Picking Accuracy:
- Go paperless with a WMS.
- Consider different order picking methods such as batch picking, picking routes, zone picking, or wave picking.
- Product velocity
- Organize inventory strategically
- Clean inventory control data and analyze error data
21. Units Per Transaction
What it is: The average number of products that customers buy in a transaction is known as the “units per transaction” metric. This can be used by retail sales teams to understand how many items customers are buying on average when they visit. A higher UPT means that customers are buying more items on average.
How to Calculate it: (Total Units Sold) / (Total Transactions)
22. Backorder Rate
What it is: The backorder rate is a key KPI for warehouse management, and it is used to predict and evaluate purchasing performance. Demands can spike at unexpected times if your forecasting is off, leading to temporarily high back order rates. A consistently high back-order rate can lead to poor experiences for customers and damage your business.
How to Calculate it: (Unfulfilled Orders at the Time of Purchase) / (Total Orders Placed)
Tips for Improving Backorder Rate:
- Improve demand forecast accuracy.
- Resolve the issues that lead to stockouts.
- Re-examine your safety-stock levels.
Reverse Logistics KPI Metrics
Reverse logistics refers to the process by which consumers ship goods back to a business. Reverse logistics is crucial to track since it reveals how a warehouse can cut costs by efficiently and properly fulfilling returns while also simplifying the process for customers.
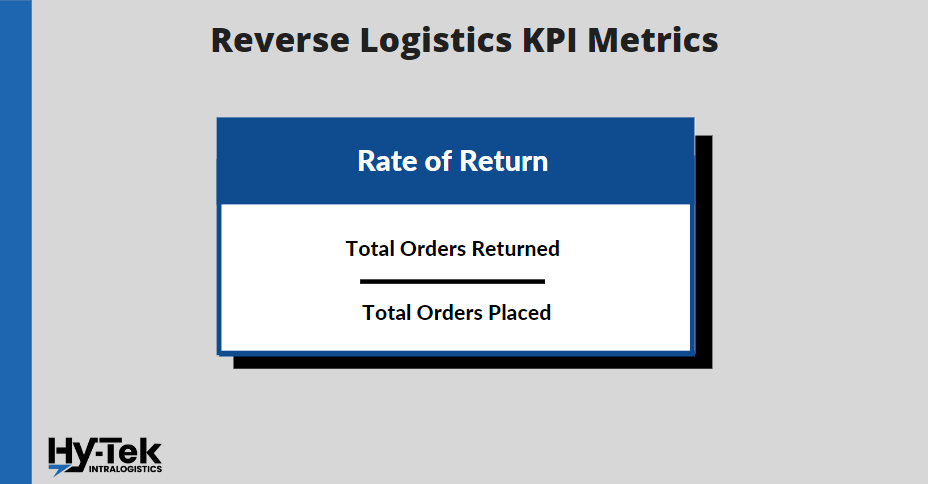
23. Rate of Return
What is it: The return rate is a fundamental warehouse KPI that indicates how often items are returned. This allows warehouse managers to understand customer satisfaction and insight resolve issues. The return rate also gives businesses a snapshot into the revenue being lost to returned goods.
The average rate of return for retail goods is 10.6% and for ecommerce items is 18.6%. These percentages will vary based on the product category with some products averaging greater than a 30% rate of return.
How to Calculate it: (Total Orders Returned) / (Total Orders Placed)
Tips for Improving Rate of Return:
- Establish a returns area to sort shipments as soon as they arrive.
- Simplify your paperwork with barcode scanners and automated conveyor routing for print and apply systems.
- For high return items, set up an area dedicated to returns to reduce long walk times.
- Determine the cause of returns and address the root cause. E.g. – Are customers not satisfied with the purchase because of a poor description or imaging on the website? Are incorrect items being shipped? Are there quality issues with the product?
- Have processes in place to get no fault found and refurbished items back into a sellable format quickly.
- Utilize flexible material handling equipment designs that will allow return items to flow back into the main distribution system.
Storage KPI Metrics
Across the several methods of storage (AS/RS, Conveyor, Vertical Lift Modules, Material Handling Equipment, Autonomous Mobile Robots) it is important to measure your process’s accuracy and efficiency.
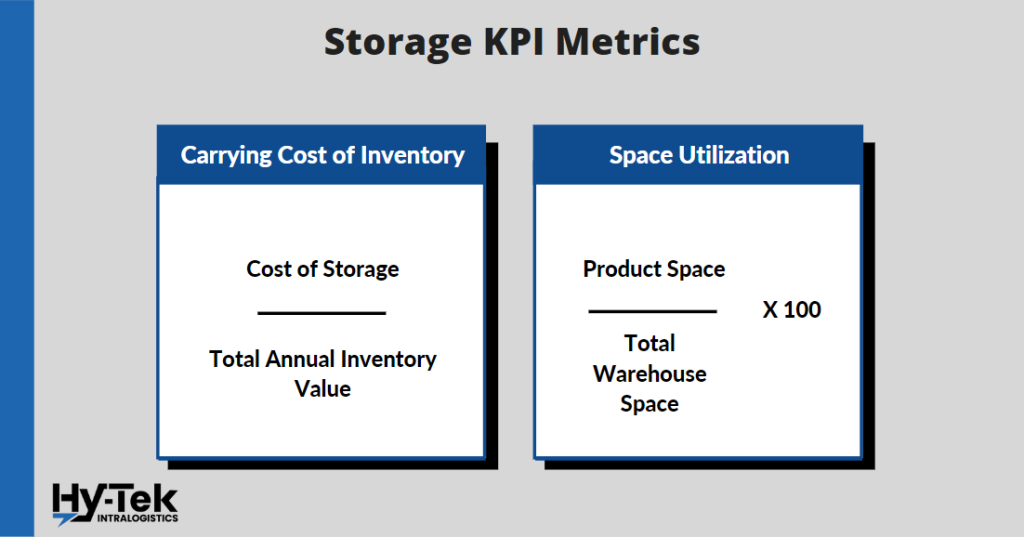
24. Carrying Cost of Inventory
What it is: The cost of inventory includes the costs of storage, service costs, damage costs, and waste. For example, if a company has to pay to store its inventory in a warehouse, it will have to pay more money as time goes on. Additionally, if the inventory is damaged, the company will have to pay for repairs or replacements. If the inventory becomes obsolete, the company may have to write it off as a loss. All of these factors contribute to the carrying cost of inventory.
“Calculating your inventory carrying cost allows you to pinpoint and optimize inventory outliers to become more profitable”
Caleb Thompson, Director of Business Development – Southern Operations at Hy-Tek Material Handling, LLC.
How to Calculate it: (Cost of Storage) / (Total Annual Inventory Value)
Tips for Improving Carrying Cost of Inventory:
- Minimize your inventory on hand and align inventory with demand forecasts.
- Increase your sell-through rate by reviewing performance by product line.
- Utilize a WMS to unlock additional visibility to real-time inventory reporting levels.
25. Space Utilization (Also Called Average Warehouse Capacity Used)
What it is: Space Utilization is the percentage of area that inventory takes up in relation to the total storage capacity. It is important to consider because it can help you determine if you need to expand your storage space or retrofit current excess storage space.
“Space Utilization is an important but challenging KPI to track and adjust with traditional storage mediums and changing inventories. Constantly adjusting storage beam levels is cumbersome and inefficient. Emerging technologies and software are making this process easier with dynamic storage and real-time slotting information”
Caleb Thompson, Director of Business Development – Southern Operations at Hy-Tek Material Handling, LLC.
How to Calculate it: (Product Space) / (Total Warehouse Space) x100
Tips for Improving Space Utilization:
- Take advantage of vertical space with extended racking or mezzanine.
- Reduce your aisle width.
- Upgrade from manual storage to a vertical lift module or AS/RS (Automated Storage and Retrieval System)
Safety KPI Metrics
Safety KPIs are performance indicators that help companies determine their safety standards. By tracking these KPIs, companies can gain insights into where they need to allocate resources to improve safety standards within the warehouse.
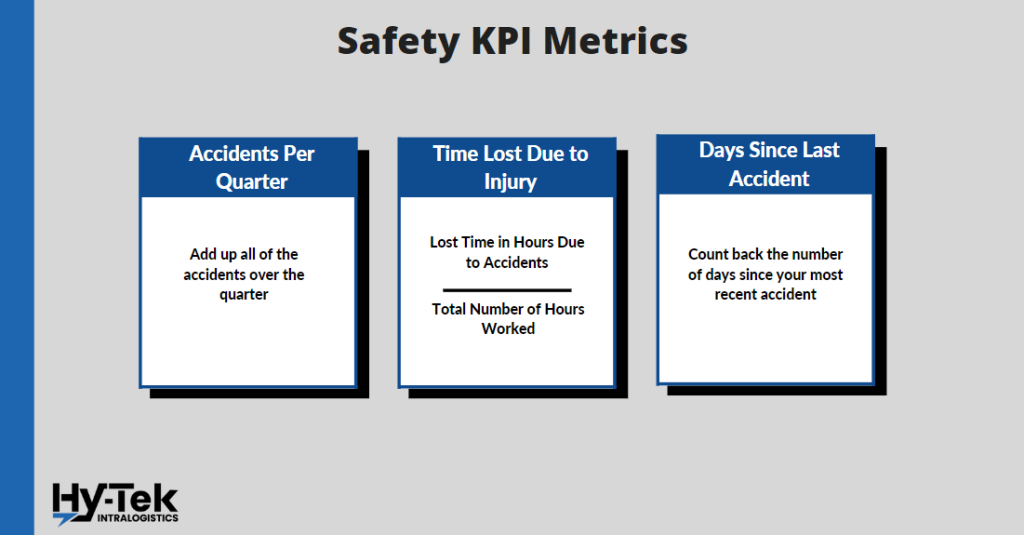
26. Accidents Per Quarter
What it is: This KPI is pretty straightforward and is an important indicator of the overall training and wellness of a warehouse team.
Tips for Improving Accidents Per Quarter:
- Review your warehouse training and onboarding procedures and ensure that safety is your number one priority in your company culture.
- Keep your stations and aisles clean and clear of any obstacles by inspecting them regularly.
- Inspect your equipment and stay on top of maintenance plans for all material handling equipment and systems.
27. Time Lost Due to Injury
What it is: Injuries sustained on the job can have a serious impact on workplace productivity. When a warehouse employee is unable to work due to an accident, managers must call on additional resources and even pay overtime for employees who are able to work. Above all else, the safety and well-being of our employees are critical. However, accidents cause delays, and the time lost due to accidents is important to know.
How to Calculate it: (Lost Time in Hours Due to Accidents) / (Total Number of Hours Worked)
Tips for Improving Time Lost Due to Injury:
- Please see the tips listed for KPI 26. Accidents Per Quarter.
28. Days Since Last Accident
What it is: This is another fairly self-evident statistic that indicates warehouse safety. You want your accident rate per quarter to be low, but you also want the time between accidents to be as high as possible. This warehouse KPI will give you a good idea of how often accidents are happening in your warehouse.
How to Calculate it: Count the number of days from the date of the most recent accident until today’s date
Tips for Improving Days Since Last Accident:
- Please see the tips listed for KPI 26. Accidents Per Quarter.
Employee KPI Metrics
The words of Brian Kristofek ring very true in today’s market, “Being a great place to work is the difference between being a good company and a great company.” A strong, positive culture is vital in a warehouse environment. Companies continue to try and find creative ways to increase employee satisfaction and retention. Despite these efforts the Bureau of Labor Statistics reports a turnover rate of 40% for Transportation Warehouse & Utilities. Having employee related metrics is critical in today’s labor market as it enables data driven decision-making that leads to behavioral changes that effect cultural in a positive way.
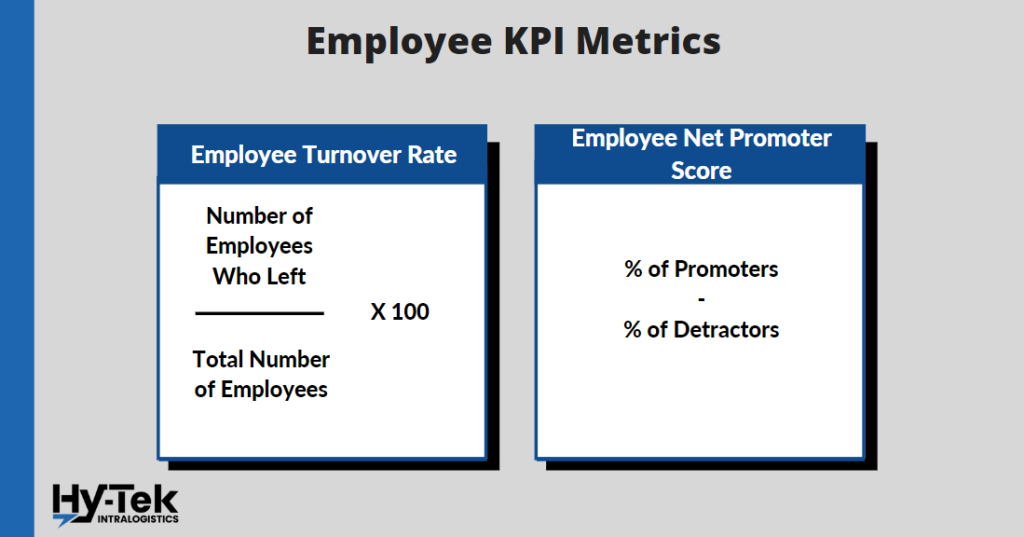
29. Employee Turnover Rate
What it is: Employee turnover rate is the percentage of employees who leave, both voluntary and involuntary, a company during a given period of time. It is important because it is one of the indications of the overall level of employee satisfaction.. High employee turnover rates are costly for companies. One of the many factors that contribute to this turnover cost is the time and resources spent recruiting and training new employees.
How to Calculate it: (Number of Employees Who Left During the Time Period) / (Total Number of Employees at the Beginning of that Same Period) x100.
Tips for Improving Employee Turnover Rate:
- Provide competitive compensation and employee benefits packages.
- Invest in a mentorship program to provide added value to employees.
- Recognize and reward employees for their achievements.
- Conduct semi-annual performance reviews for all employees.
- Solicit feedback through employee engagement surveys to capture ideas on how to improve company culture.
30. Employee Net Promoter Score
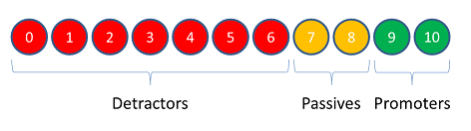
What it is: Employee net promoter score (eNPS) is a metric used to measure employee satisfaction and engagement. It is calculated by surveying employees on how likely they are to recommend the company to a friend or family member on a scale of 1 to 10.
- Scores of 1-6 are called detractors
- Scores of 7-8 are called passives
- Scores of 9-10 are called promoters
eNPS Scores subtract the percentage of passives from the percentage of promoters. The total eNPS scores range from -100 (extremely unlikely to recommend) to 100 (extremely likely to recommend).
How to Calculate it: (% of Promoters) – (% of Detractors)
Tips for Improving Employee Net Promoter Score:
- Listen and take action on reoccurring employee concerns. Employees who feel heard will be more likely to communicate and provide actionable feedback to improve culture, engagement, and performance.
- Provide opportunities for employees to provide input outside of the Net Promoter Survey. Frequent touch bases with employees not only give them the opportunity to provide informal feedback, but it also creates open dialog between employee and manager which contributes to a positive company culture.
- Regularly meet with employees and ensure they know what you expect from them, and what success looks like for their role. Employees who are aligned with their leader’s expectations are more engaged.
FAQ
What are the recommended KPIs to monitor warehouse performance?
Average Warehouse Capacity Used
Order-Picking Accuracy
On-Time Shipments
On-Time Ready to Ship
Inventory to Sales Ratio
Dock-to-Stock Cycle Time
Inventory Turnover
How do you improve warehouse performance?
1. Make the most out of your available space
2. Master demand forecasting to prevent dead stock
3. Improve your returns process
4. Utilize a WMS and labeling technology to improve order accuracy
5. Upgrade to an automated storage and retrieval system