What is a Goods to Person Picking System?
Goods-to-person (GTP) picking systems such as pallet load automated storage and retrieval systems (AS/RS), mini-load cranes systems, shuttle systems, and carousels, have been around for many years, and more recently, robotic-supported goods to person picking systems have entered the field. These robotic systems work to alleviate employee foot travel, increase facility productivity, and help reduce the active/pickable inventory footprint.
Operationally, at a high level, goods to person picking systems receive and store incoming goods via induced pallet, carton, or tote/bin. Once placed into storage, this product can later be automatically retrieved and sent to a pick station for outbound orders. The process of storing and retrieving is automated with a goods to person picking system.
Determining Which Products to Put in the Goods to Person Picking System
When considering a GTP picking system, one question that should be asked is, “What products are most efficient for this goods to person picking system?” All systems have their unique advantages, but all have disadvantages as well. For one, no single system can handle all shapes and sizes of products available on the market. Choosing which items to store in a goods to person picking system will be a determining factor both in the efficiency of the solution and in its return on investment (ROI).
The initial step to determining which items are most efficiently stored in a robotic goods to person picking system is to understand the facility’s outbound order profile and, hence, its demand. The order profile can be complex and have a significant impact on the size and configuration of the goods to person picking system. Below, we outline a few factors to consider with a proposed system as well as some general ideals around what types of items are best stored in a goods to person picking system.
Stock Keeping Unit Count
The SKU count refers to the total number of unique SKUs to be housed in any given area. When considering a goods to person picking system, the SKU count should account for proliferation. In other words, any period of rapid SKU count growth should be accounted for. In effect, the number of SKUs will determine the number of locations in the system. Therefore, if we don’t account for proliferation, the system will likely be too small. The number of locations that the goods to person picking system includes will help determine which SKUs to store in it.
In many cases, a location can be a tote or a compartment within a tote when using tote partitions. Location size is based on volume or cube of the product stored in it, and the number of locations per SKU is generally based on velocity or activity. For example, the Exotec Skypod System can store multiple SKUs in a single storage bin that is 600mm x 400mm (23.6” x 15.7”). The bin can be partitioned into two, four, six, or eight compartments depending on your needs. Alternatively, Caja Robotics’ system can receive a master case and store it without first needing to decant the products into a tote.
Inventory Movement
Consider the following scenario: your eCommerce business experiences increased volumes for the holidays in November and December, and the volume increases by a factor of 10:1. If you choose to size the goods to person picking system to meet the demand in this time frame, you will have a solution that is over-built for 10 months out of the year. What is the appropriate size for your business in this scenario? Do you build the system to satisfy demand during the holidays or for the remaining 10 months? This is the million-dollar question that must be answered to recognize the highest return on investment. Now, consider another scenario where a food distribution company, which is in the consumable sector, has little seasonal variation. In this scenario, the goods to person picking system should be sized to have little fluctuation.
The Pareto Analysis, which analyzes how skewed the inventory movement is, is often interpreted as the 80/20 rule. Pareto’s Law assumes that roughly 80% of consequences come from 20% of causes, or, in terms of order picking, 80% of the volume is picked from 20% of the picking locations. To be fully transparent, this rule is not always true in fulfillment, and the Pareto analysis might show that 10% of items account for 50% of the activity, and 90% of items account for the remaining 50%. An analysis can be done to determine the ratios which will, in turn, help determine which products to store in the goods to person picking system.
A simple way to find a Pareto is to take total movement by SKU for a specific timeframe and order that list in decreasing order by volume. Record the SKU count accounting for each 10% volume increment. You may find the top 10-15% of SKUs account for 60-70% of the volume.
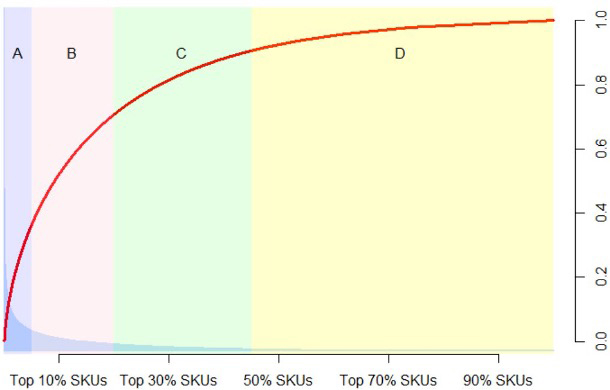
| FIGURE 1, PARETO ANALYSIS FOR INVENTORY MOVEMENT |
| Once SKUs have been arranged in decreasing order by line count or unit quantity (we generally use line count, or the number of times an item is picked from), a plot like Figure 1 can be produced. The primary tool in this plot is the red curve that plots SKU count against the percentage of cumulative line counts. From here, selection of where to segment and group SKUs can be made by locating natural or attractive breaks along this curve. For example, the A movers and D movers are most easily recognized as the A movers’ break occurs as the curve wains from a vertical trajectory, and the D movers begin as the curve plateaus. Here, we have illustrated our groupings through shaded color where we have the top 5% of total SKUs make up the A movers (accounting for roughly 40% of total line movement) while the D movers, make up over 50% of the total SKUs and account for just under 10% of the total lines. Worth noting, if this plot is desired, a relative line movement by SKU can be seen most clearly as the purple shaded curve in the lower left portion of the plot. That is, the fastest line moving SKU has a bar the height of the plot, and all other items have a height relative to this first item. |
This analysis can be used as input to develop useful categories of product movement, such as A, B, C, while D movers which refers to how fast the SKUs move and must be replenished. A movers are the fastest moving SKUs, and D movers are the slowest. Whether the Pareto curve is steep or flat will determine which system would be best for your business. A steeper Pareto, such as 80/20 distribution, would benefit most from a top-driven goods to person picking system. A flatter Pareto, such as 60/40, may necessitate a system with more immediate access to every SKU such as Exotec Skypod System.
Goods to person picking systems have a limited number of pick/replenishment stations, and you may limit your output if you are continually needing to re-stock the system with fast-moving items. Therefore, you may consider either having multiple bins for fast movers, or opt for a traditional picking methodology for A movers while saving the goods to person picking system for B, C, and D movers. Choosing the latter option means that the A movers can be stored in an efficient method outside of the goods to person picking system and can be consolidated into a zone for reduced travel distance which ultimately reduces the labor costs associated with these SKUs. Storing the B, C, and D movers in the goods to person picking system, eliminates walking for these items.
Operational Constraints
The Pareto analysis is a great start to understand which items to store in the goods to person picking system, but a more in-depth operational assessment should be completed as well. This assessment often reveals important details impacting the final decision. The assessment will cover items such as throughput fluctuations, order cut-off times, number of fulfillment shifts, growth projections, initial capital investment, manageability, total labor, accuracy, product security, space, and speed of processing required.
Physical Constraints
The SKU size, which refers to both the physical size and quantity, is a huge determining factor to the overall sizing of the goods to person picking system. For example, a basketball takes up much more space than a tennis ball, and special considerations would need to be made to accommodate the basketball. Also considering whether an item is packaged or not will impact whether it is suitable to be stored in a goods to person picking system.
Environmental Constraints
There may also be environmental constraints to consider (e.g., temperature requirements). If some products are required to be kept in a freezer and others are not, this would affect which items should be placed in the goods to person picking system. Similarly, any USDA or FDA requirements that your business is obligated to follow must be considered.
Summary
Your product mix may make it possible to store all SKUs in robotic goods to person picking system, however, as a broad generalization, the slower moving B movers, C movers and D movers are typically the best SKUs to store in the system during peak periods. High velocity A movers might be best served off-system. In non-peak periods, all SKUs may be stored based on physical size and not necessarily velocity of movement. Of course, each business case is different, and a thorough analysis should be completed prior to any firm recommendation of a specific solution and determining which products to store. If your company is considering implementing a robotic goods to person picking system, Hy-Tek will perform the analysis which will be used to choose the appropriate solution and configuration. Once the solution is chosen, Hy-Tek will fully integrate it into your current operations.